

Australia’s grid has long leaned on coal, which fueled industrial booms and suburban sprawl for decades. Black and brown coal plants, like those in the Latrobe Valley and Hunter Region, provided cheap, round-the-clock power but at the cost of soaring greenhouse gases. Renewables started small—hydro from Snowy Mountains in the mid-twentieth century, wind farms dotting Tasmania by the 1990s. The rooftop solar revolution ignited around 2010, turning homes into mini power plants. By the early 2020s, wind and large-scale solar scaled up, aided by falling panel prices and turbine efficiencies. Coal’s share hovered above sixty percent into the 2020s, but closures accelerated: Hazelwood in 2017, Liddell in 2023, and more slated for shutdown. This pivot aligns with net-zero pledges, slashing emissions while chasing energy security amid global volatility.
Current State of Play
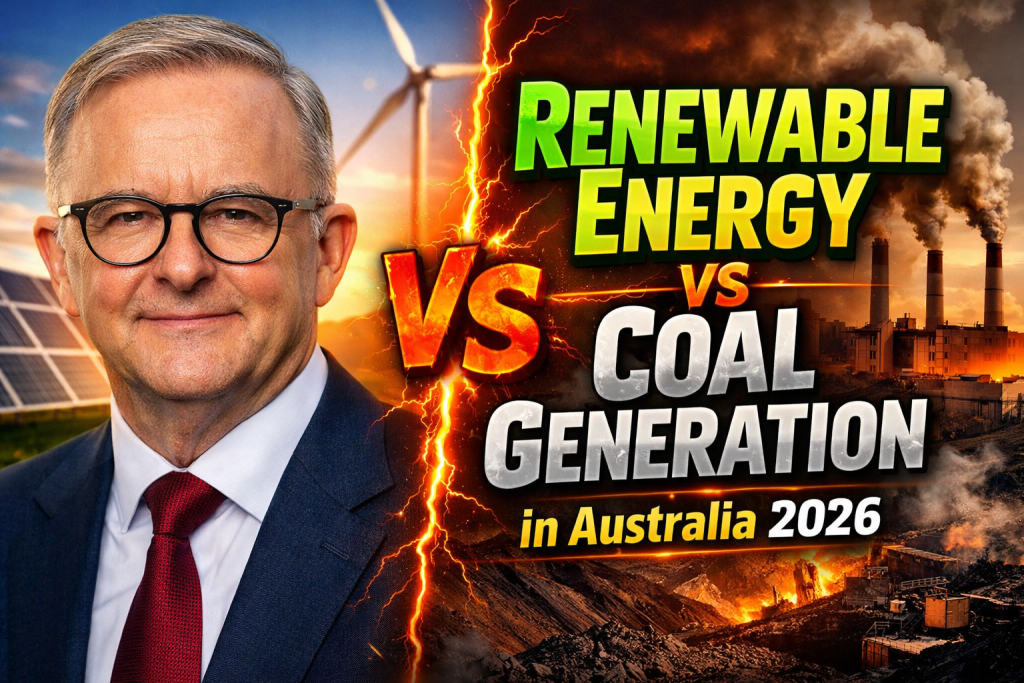
Entering 2026, renewables have surged past coal in quarterly averages. In the final quarter of 2025, they delivered fifty-one percent of supply in the NEM, including hydro, wind, solar, and batteries—a leap from forty-six percent the prior year. Grid-scale solar and wind averaged over six thousand megawatts, up twenty-three percent, with wind jumping twenty-nine percent on stronger breezes. Rooftop solar hit a record four thousand four hundred megawatts average, piercing sixty percent of demand at peaks. Batteries exploded: discharges tripled to two hundred sixty-eight megawatts, backed by nearly four thousand megawatts of new capacity added since late 2024.
Coal tells a stark contrast story. Its output plunged to an all-time low of eleven thousand five hundred megawatts average, down four point six percent year-on-year. Gas followed suit, dropping twenty-seven percent to levels unseen since 2000. Emissions cratered to twenty-three point four million tonnes of CO2-equivalent, a six point two percent dip. Wholesale prices halved to around fifty dollars per megawatt-hour, proving renewables’ downward pressure on costs. Western Australia’s market mirrored this: renewables at fifty-two point four percent, coal and gas shares eroding by five point eight and sixteen point four percent.
| Metric | Renewables + Storage (Q4 2025) | Coal (Q4 2025) | Change YoY |
|---|---|---|---|
| NEM Share (%) | 51 | ~35 (est.) | Renewables +5 pts |
| Average Output (MW) | Solar/Wind: 6,627; Batteries: 268 | 11,544 | Coal -4.6% |
| Peak Contribution (%) | 78.6 (half-hour record) | N/A | New high |
| Price Impact (AU$/MWh) | Halved to 50 | Higher marginal cost | -39 overall |
| Emissions (Mt CO2-e) | N/A | Contributed to low | -6.2% total grid |
Technological Drivers
Solar’s triumph stems from abundance: Australia boasts world-leading irradiance, fueling both utility farms and thirty percent household penetration. Panels now cost pennies per watt, with bifacial tech capturing rear-side light for extra yield. Wind thrives offshore and onshore, with larger rotors harvesting steadier flows; South Australia’s Hornsdale set benchmarks via battery stabilization. Batteries—lithium-ion giants like Tesla’s—bridge intermittency, discharging at dusk when solar dips. Flow batteries and pumped hydro emerge for longer storage, holding days’ worth.
Coal lags in innovation. Aging plants suffer breakdowns, with efficiency below thirty-five percent versus gas combined-cycle’s sixty. Retrofitting carbon capture proves pricey and unproven at scale. Renewables integrate smart grids: AI forecasts output, demand-response apps shift usage, and high-voltage lines like Marinus Link connect Tasmania’s hydro bounty eastward.
Policy and Investment Landscape
Government muscle accelerates change. The Capacity Investment Scheme funnels billions into renewables, targeting eighty-two percent clean power by 2030. Rewiring the Nation upgrades aging poles for bidirectional flow. States push hard: New South Wales phases out Eraring early, Queensland eyes zero coal by 2035. Private capital floods in—over three thousand megawatts of projects approved yearly. Clean Energy Finance Corporation lends low-risk funds, while tax incentives lure superannuations. Coal clings via subsidies and contracts, but investor flight to ESG funds starves upgrades. International pacts, like COP commitments, tie aid to transitions, retraining miners for solar installs.
Challenges persist: Transmission bottlenecks strand remote wind, community pushback delays lines. Yet incentives like feed-in tariffs and virtual power plants aggregate rooftop arrays into grid anchors.
Economic Impacts
Renewables slash bills—Q4 2025’s price drop saved households hundreds yearly. Jobs boom: solar employs twice coal per gigawatt, with forty thousand roles versus coal’s twenty-five thousand. Regional economies pivot—Idaho’s coal towns spawn battery factories. Coal-dependent areas like Collie secure just transitions: funds for hydrogen hubs and worker reskilling. Exports shift too—green iron and ammonia eyed over met coal. Volatility eases as diversified sources buffer droughts or floods.
| Economic Factor | Renewables Advantage | Coal Drawbacks |
|---|---|---|
| Job Creation | 2x per GW; rapid scaling | Declining; mine closures |
| Household Savings | Lower wholesale; net metering | Fixed high costs |
| Investment Flows | $30B+ annual; global supply chains | Divestment; stranded assets |
| Regional GDP Boost | New hubs in QLD/NSW/SA | Losses in VIC/NSW valleys |
Environmental and Reliability Gains
Emissions plummet, aiding Paris goals—grid CO2 down over twenty percent decade-on-decade. Coal’s particulates and mercury fade, cleaning air in basins like the Hunter. Renewables cut water use dramatically—solar needs near-zero versus coal’s billions of liters daily. Reliability? Batteries firm supply, with black-start capability reviving grids post-outage. NEM’s inertia services stabilize frequency sans coal’s spin. Peak renewables hit ninety-one percent in WA without blackouts, debunking intermittency fears.
Risks remain: Rare earth supply chains for batteries spark mining debates, blade waste needs recycling mandates. Coal retirements demand synchronous condensers to mimic inertia.
Future Projections
By end-2026, renewables could claim sixty percent NEM share, per AEMO forecasts, en route to ninety-five percent by 2040. Coal retires fully by 2038-2042, replaced by seven thousand megawatts offshore wind, forty gigawatts solar, and twenty gigawatt-hours storage. Hydrogen and green steel electrify industry. Snowy 2.0 doubles hydro, while interstate links unify markets. Demand surges from EVs and data centers, but efficiency and electrification cap it.
Scenarios vary: Bull case sees sub-forty dollar megawatt-hours; bear needs policy grit against gas lobbying. Global trends—China’s solar flood, Europe’s heat—bolster supply.
Challenges Ahead
Gridlock looms: Forty billion in poles and wires needed, facing NIMBYism. Skills gaps hit—engineers flock to renewables, coal engineers retire. Cybersecurity shields smart meters from hacks. Extreme weather tests resilience; bushfires scorched lines before. Coal lobbies for extensions, citing baseload myths despite batteries’ dispatch. Equity matters: Low-income homes lag solar adoption without rebates.
Conclusion: A Greener Grid Emerges
Australia’s 2026 grid heralds renewables’ victory over coal, blending tech, policy, and economics for affordable, clean power. This shift not only curbs warming but powers prosperity. As panels gleam and turbines whirl, the sunburnt country leads the world’s energy dawn—reliable, renewable, and ready.

Nirti Singh is a news writer and digital content contributor at KorakoSpecklePark, covering key stories and regional developments across New Zealand and Australia. Her work focuses on clear, fact-based reporting, ensuring readers receive accurate and timely information.